Deutsche Bahn Booking Experience
Establishing quality metrics across platforms is a huge challenge especially for companies that offer both online and offline experiences. In a team composed by six TU Berlin students, I designed and planned an experiment for measuring user satisfaction in the services offered by Deutsche Bahn (DB), the German railway company. The study, which compares the website and the ticket machine booking experiences, was an assignment for the seminar “Human Machine Systems” at TU Berlin. Besides designing and deploying the human-subject experiment, another requirement was using at the same time methods that capture physiological, behavioral, and attitudinal data. As the goal of this project was to evaluate the service quality of experience instead of optimizing the system, I started by defining a research question instead of an objective that maximizes a key performance indicator.
Research Question: which DB booking experience generates higher user satisfaction?
The metric that I choose for assessing user satisfaction was the Customer Satisfaction Score (CSAT-score), which measures the percentage of users satisfied with the service in the episode of usage, i.e., right after experiencing it. Experiment participants could answer the question “How would you rate your overall satisfaction with the booking experience?” with a score ranging from very unsatisfied (1) to very satisfied (5). When performing user testing that could include non-experienced users, the CSAT-score is preferred to the Net Promoter Score (NPS), which has the goal of assessing the user loyalty, that is the user satisfaction in a multi-episodic history of usage.
Hypothesis: the user satisfaction is higher with the website because it is more user friendly, it is easier to use, and less stressful.
The UX Researcher toolbox
By now I have a dependent variable called user satisfaction that is impacted by the independent variable booking experience, which has two levels: website and ticket machine. In this study I understand user satisfaction as a function of system user friendliness and the effort necessary to accomplish a task. In order to quantify the influence of different booking experiences in these variables, I decided to measure the user friendliness with the System Usability Scale (SUS) survey, besides considering the click/time rate and a physiological stress metric as proxies for required effort (Table 1).

The SUS survey is a 10-items questionnaire with assertions that can be answered using the 5-point Likert scale. Each question has its rephrased version, what accounts for robustness in the measurement of attitudinal data. Moreover, SUS is broadly used and validated, reliable for small samples, besides enabling comparisons between results. The intuition behind considering click/time a metric of effort is that the speed of the user interaction with the interface decreases if utilizing the system is costing. In other words, users need more time to decide which button to click next in complicated interfaces.
Another measure of effort used in the experimental design was the Electrodermal Activity (EDA) measured with a BITalino biosignals platform. EDA captures the resistance of the skin to a small electrical current caused by its neural response to stress. To make it simpler: a person sweats when his/her stress level is high, which increases the skin conductance. An advantage of BITalino compared to other devices that measure stress such as an Apple Watch is its algorithmic transparency and the open access to the raw data points.
As our sample size in this study was constraint to ten people, we decided that a within-subjects experimental design would be the best choice. A between-subjects design would split our participants into two groups, decreasing the sample size and, consequently, affecting the power of the study. Applying the within-subjects design it is more likely that we will have statistically significant results in the end of the study.
Although deploying this experiment in the field was initially a constraint, as we could not move a ticket machine to the lab, it also has the benefit of preserving the study external validity, due to the similarity between our setting and a real-world situation. On the other hand, in lab experiments the researcher can keep control of undesirable influences, what maintains the experiment internal validity high and facilitates experiment reproducibility.
Preventing bias in the study design
Offering the participants written instructions is the best way to ensure experiment objectivity and avoid the observer-expectancy effect, that is, when the experimenter expectations influence the study result. This could happen, for instance, if a researcher tells more details about the experiment intended outcomes to one of the participants.
In each one of the treatments the participants must accomplish four tasks, which basically consist in buying tickets with different conditions, such as booking a group travel or buying an extra ticket for a child. A survey is applied when participants accomplished the set of tasks for each experience. Because humans retain more easily information presented in the beginning and in the end of an event, a phenomenon called respectively recency and primacy effect, I decided to randomize the order in which the tasks are presented in each treatment for all participants. Besides that, half of the participants started the experiment on the website, whereas the other half judged the ticket machine first, controlling for any effect caused by participant’s fatigue in the ratings. Both steps have the goal of setting aside as much as possible the impact of human bias in the experiment’s outcome.
Finally, it was necessary to isolate the influence of the ticket price in the user satisfaction across treatments by establishing for each of them different city destinations. As the participants were requested to buy the cheapest tickets, they could get upset if they find a more expensive ticket when deploying tasks in the last treatment. Comparing between treatments could decrease their satisfaction rating drastically, especially if they have the sensation of making a bad deal. This effect is well known in the behavioral economics’ field as loss aversion, in other words the human tendency to avoid loss due to our higher sensitivity to losing than to winning.
Experiment deployment and results
The user tests were conducted in the field by two trained colleagues who were also responsible for recruiting the participants. Due to time and resources constraints, our study has a very small sample size of ten people. Although my colleagues have made the effort of inviting a diverse user base, the study sample was still mainly male (60%), young (80% between 21-29 years old), and highly educated (70% are enrolled in universities). When asked about how often they use the DB booking systems, the answer’s distribution shows that the participants use the website more often than the ticket machine. As shown in the figure below, 30% of participants buy tickets on the website at most six times in the year, whereas 40% use the ticket machine once a year to book their trips.

Ratings from the first and second presented treatments were not significantly different, validating the success of our randomization system. The statistical test used in the analysis was the t-test for related samples from the scipy Python package, which is used to estimate whether the difference between two measurements from the same set of study participants could have happened by chance. To refute the null hypothesis that both average expected values are identical, the test p-value should be smaller than 0.05.
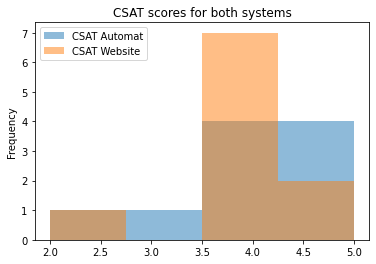
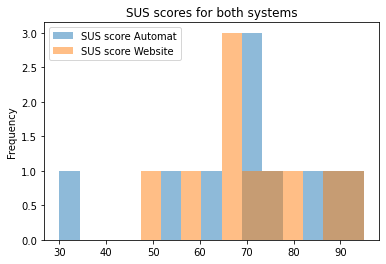
Because of our sample size being too small, the only statistically significant difference found between our metrics was the average number of clicks per task, which was higher for the ticket machine (mean of 30 clicks/task) than for the website (mean of 24 clicks/task). Although the CSAT score of both systems are identical, the percentage of participants satisfied with the website is higher (90%) than with the ticket machine (80%). Moreover, the usability of these systems was also above average, given that their SUS scores were higher than 68 (for more on interpreting SUS scores see this Jeff Sauro’s article).
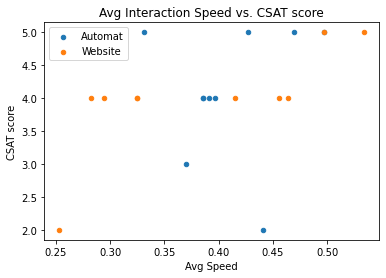
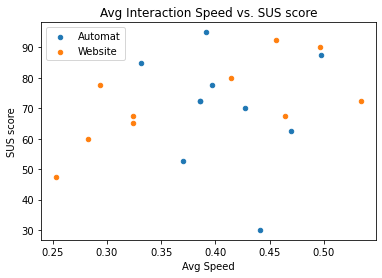
There is statistically significant strong positive correlation between SUS and CSAT scores for both website and ticket machine, proving that good usability and user satisfaction walk hand-by-hand. However, average task duration and interaction speed only impact SUS and CSAT ratings when booking tickets on the website. For this treatment the Pearson correlation analysis shows a strong relationship between high interaction speed and high SUS and CSAT scores. On the other hand, the longer it takes in average for the participants to deploy a task on the website, the lower are the SUS and CSAT ratings attributed to the system.
In conclusion, our study shows no significant evidence to the hypothesis that “the user satisfaction is higher with the website because it is more user friendly, it is easier to use, and less stressful”. Furthermore, both DB systems have above average usability and satisfy the users’ needs. The only downside of the ticket machine was the higher average number of clicks, which is understandable due to the interaction interface’s limitations. Surprisingly, the participants seem less tolerant with usage difficulties on the website than on the ticket machine.
Note: the EDA data analysis will be done by another colleague and added to this conclusion later for the sake of completeness.


